Data analysis and visualisation tool. Load a spreadsheet and view the data as graphs and charts. Use these visualisations to see progress and patterns which can aid you in making optimal descisions!
Simple to use, load a CSV and select the graph type and any filtering required. No programming or complex options to learn!
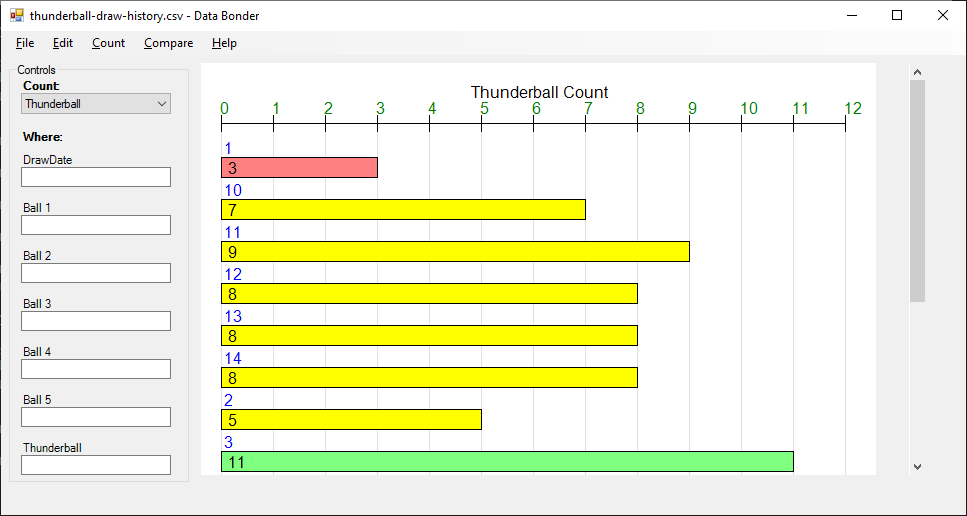
Using the Count method, you can see how many matches there are in a list. Use this to check for popularity.
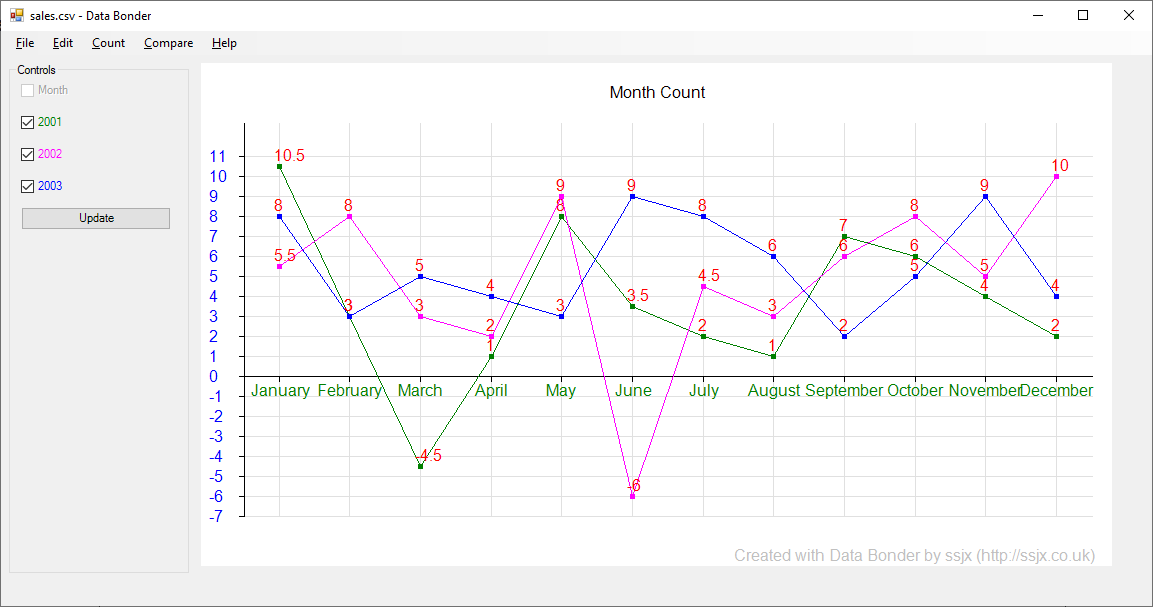
The Compare methods let you overlay multiple data values on to a chart. This can be used to compare performance over time as shown below.
When you have a graph you like, simply click Copy, then paste it into a document or email to share with colleagues.
Multiple graph and chart types including scatter graphs, horizontal/vertical bar charts and single/multiple line graphs.
Combine data from other sources with the easy to use merge option. Just select a file and pick the fields to link with!
Free! No subscriptions or licensing, just download and run!

Version 0.5b (19KB Zip)
Updated (06/07/2026)